A question posted on the Inside Customer Service LinkedIn group recently caught my attention. Celeste Peterson, a Customer Advocacy Supervisor at Palo Alto Software, asked:
What do you think are the most important metrics to track for a small customer service team?
There were a few nice responses. Celeste's question intrigued me personally because I've heard it a lot recently and even wrote this blog post about it. So I reached out to her and we eventually set up a call that included Sean Serrels, Palo Alto Software's Director of Customer Advocacy
During our conversation, we discussed what the company's executives were most concerned about when it came to customers. I learned that company leaders were particularly concerned with reducing customer churn for its LivePlan online business planning software.
LivePlan is a subscription-based software as a service product, so customer churn (when a customer cancels their subscription) represents a loss of recurring revenue.
I gave them a few suggestions and Celeste promised to follow-up and let me know how things went. Here's their update.
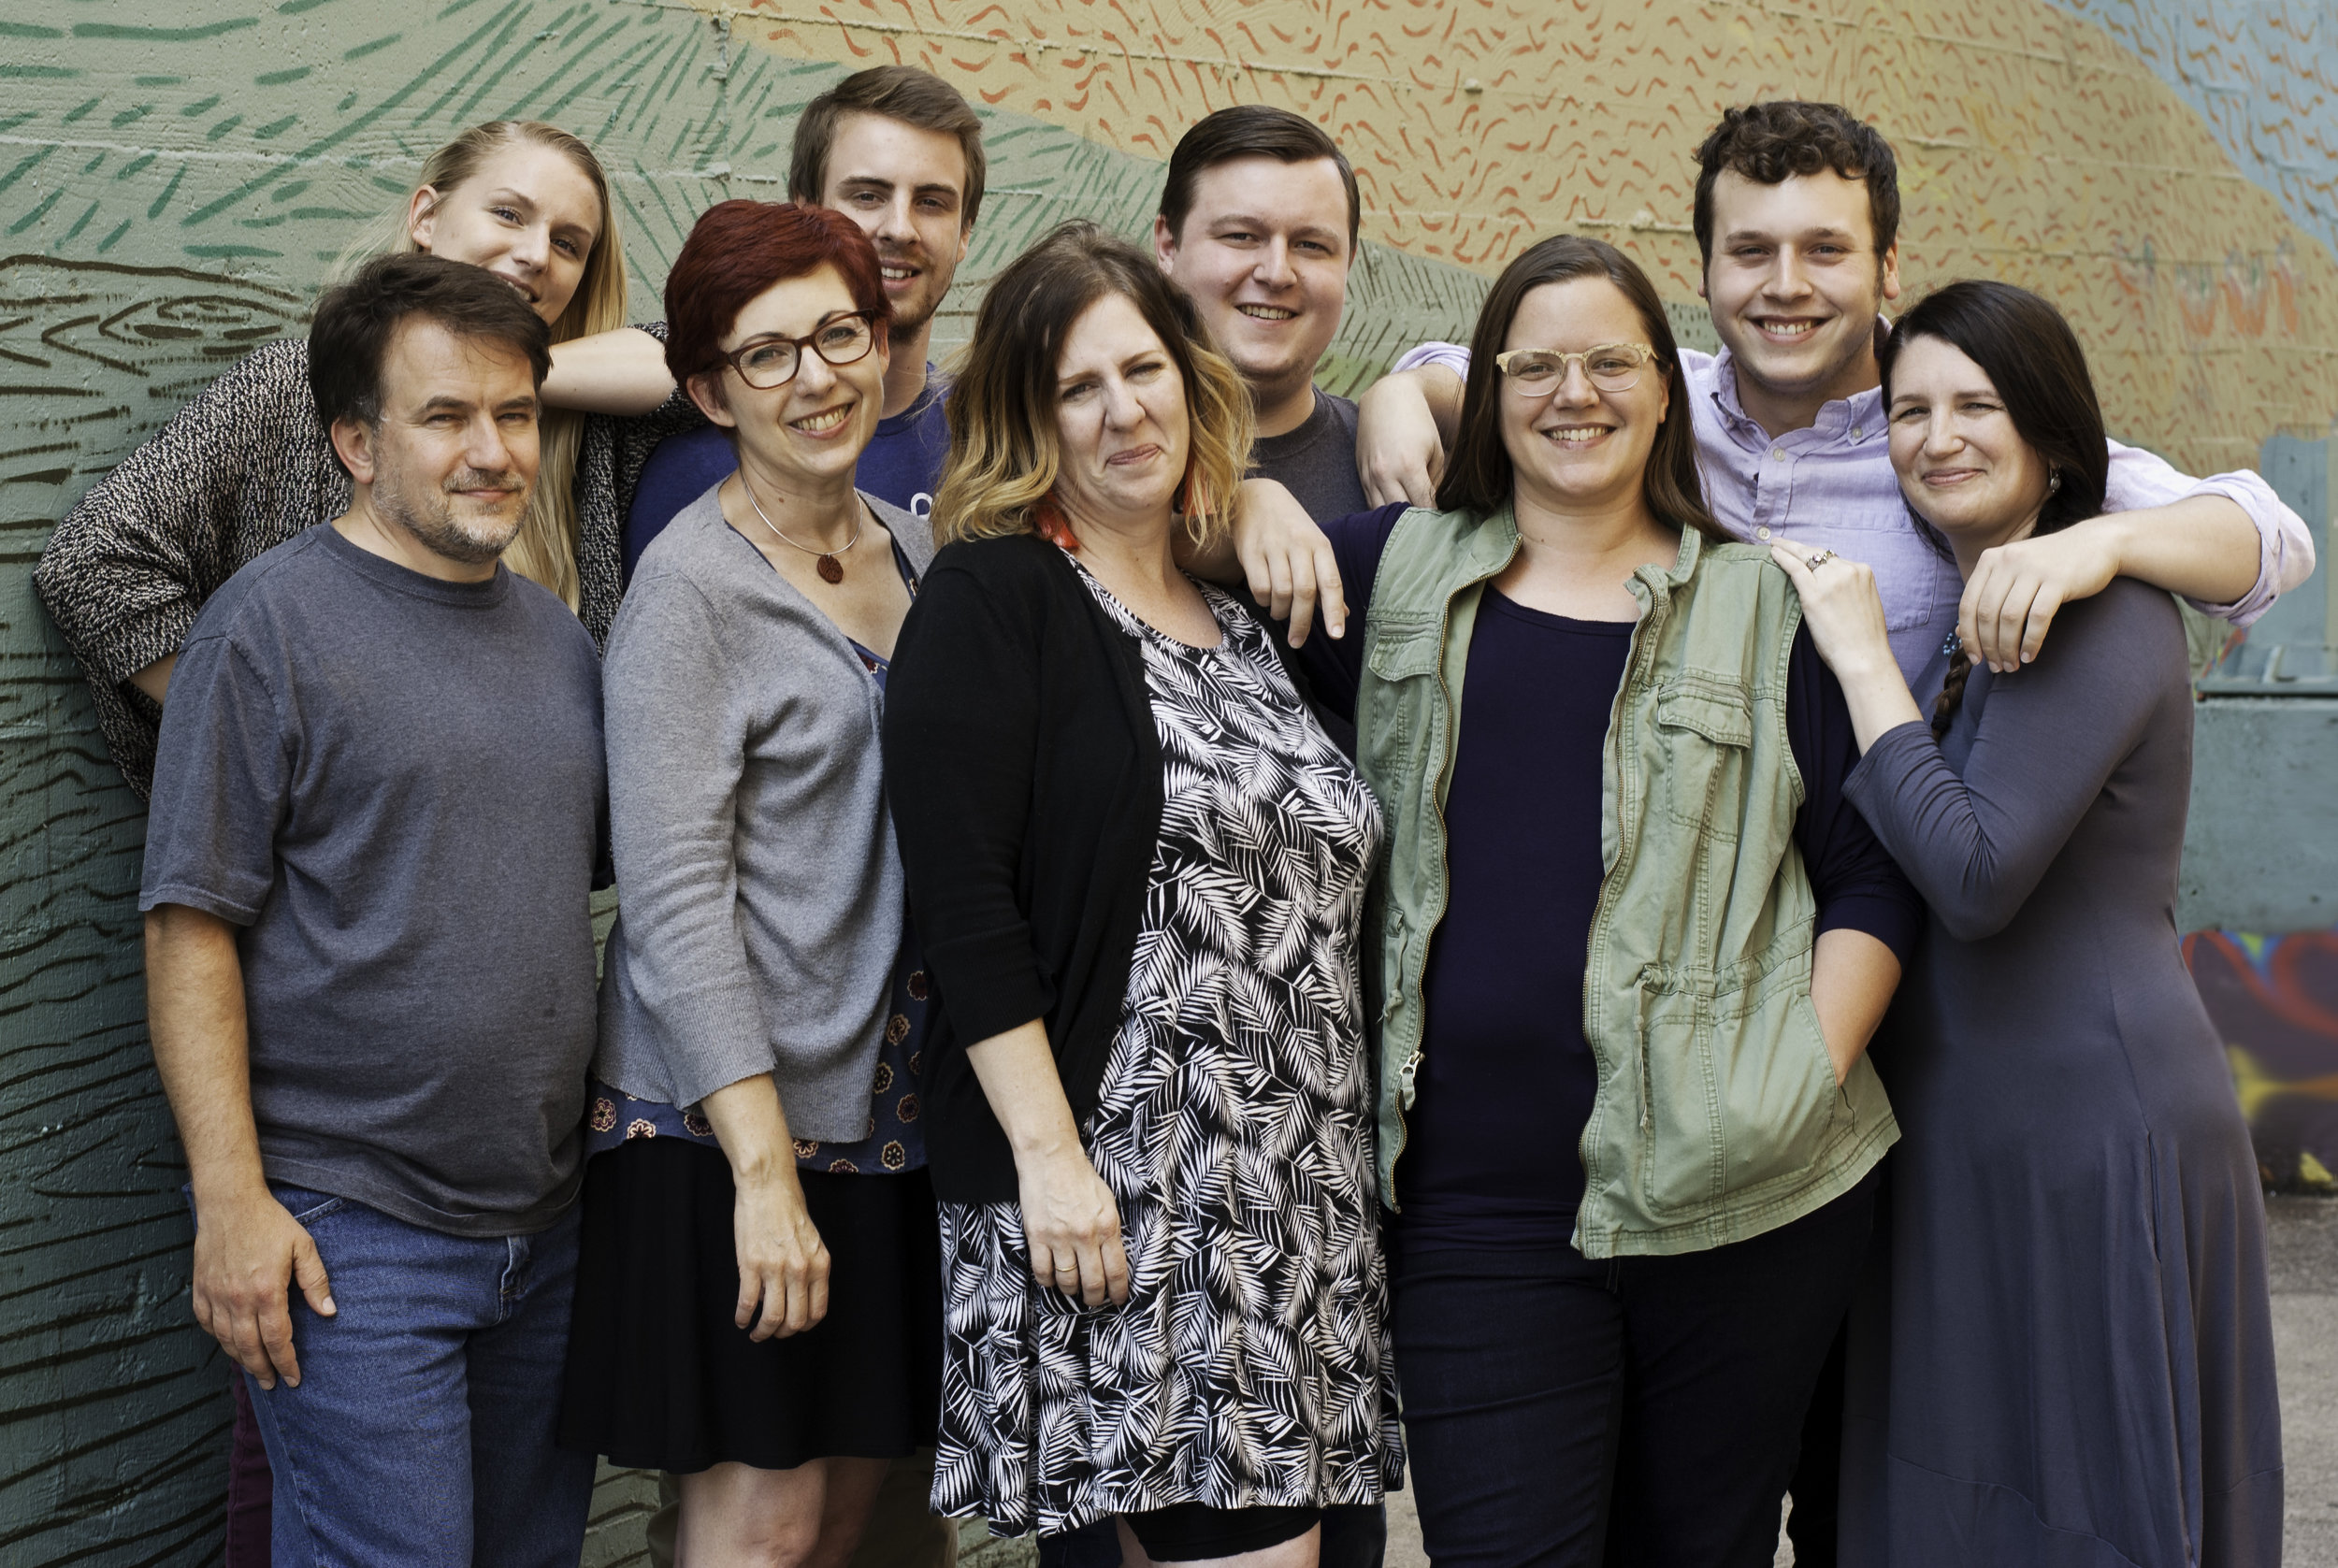
Palo Alto Software's Customer Advocacy Team
Jeff: What's new since we had our conversation?
Celeste: "Since we talked, we did some brainstorming, particularly about reducing churn for LivePlan. Our Development team informed us of data they've collected about groups who churn more than others, and we've made some changes to try to reach out to those groups and give them more attention.
"For instance, we noticed that a lot of the churners seemed to feel like they had to get in, complete their plan in the first day, and then not come back. Those that came back a second, or third day in the first week, were way more likely to stay for at least 90 days.
"I wondered, do new users who communicate with CA in the first week churn less than new users who don't? If so, how can we reach more of those users?"
Jeff: It's a smart idea to start with a few questions and then dig into your data to find the answer. What did you learn?
Celeste: "Sean added live chat triggers to the page in the app where people are setting up their business plan the first time they log into their new account. [Editor's note: this means customers are invited to start a live chat session with a customer advocacy agent when they reach this page.]
"We've been getting lots of questions from users via those chats. Many request help changing their account settings, or finding the features they’re interested in, and we have been able to help them with that instantaneously, which produces satisfied customers. We also use the information gathered from those chatters to create or edit our Help Center content. If a few users have questions about a feature, others probably do, too.
"We've also added a chat trigger on the cancellation page of the app to see if we can resolve anything someone is frustrated about before they click the cancellation button! Those chats have been very active, too.
"Another purpose for these chats is to try to get more feedback from users who are canceling so we can learn more about what causes churn. We share that feedback with our development team. Sharing data and customer feedback with other departments is an important part of what our Customer Advocacy department does. The data we received from the Development team about churn helped us decide where to best implement new chat triggers, and the feedback we receive from those users helps the Development team decide what changes to implement in the app."
Jeff: Connecting with customers right when they need you is a great idea! Has this made an impact on customer churn?
Celeste: "We have to have patience to wait and follow cohorts to track how it's affecting churn, but we'll take a look at those users down the road and see if they are staying longer than people who didn't chat with us when they started. Overall, our churn has recently decreased, so we are excited to stay the course.
"We are discussing ways to change our delivery or framing of responses to maintain a positive user experience, even if a feature was not what that user expected.
"For instance, we discussed better ways to respond to people who were confused about the annual pricing. The site explains the lower monthly price and that it's 'billed annually,' but sometimes a customer complains they weren't expecting the 12 months of charges to hit their bank account at one time.
"In the past our customer advocates apologized for the confusion and offered to convert the account to a monthly one. Now, rather than immediately addressing their confusion and apologizing, giving a negative impression, we empathize, and focus on the positive, that the annual subscription provides the benefit of a 40% discount by collecting for 12 months in advance. We also let the customer know that we're happy to convert it to the monthly option or cancel and refund if they prefer, since we have a 60 day money back guarantee. With that positive framing, along with collaboration with the marketing team to test various wording on the sign up page, we’ve been seeing a decrease in churn and refunds of annual subscriptions."
Jeff: You mentioned earlier that it will take awhile to see if your overall churn rate improves. Are there any other metrics that are giving you more immediate feedback?
Celeste: "An important metric for Customer Advocacy and preventing churn is our customer satisfaction rate. Our average rate has been a wonderful 97% this year, but I did notice, by looking at metrics for satisfaction and first reply time simultaneously, that there is a strong relation between the two.
"We are often at 100% satisfaction when our first reply time is below 8 hours. Most of the unsatisfied ratings happen around Monday when we have a larger email queue built up over the weekend when we're closed. I have adjusted our schedules and workflow to try to keep the first reply time low on Sunday and Monday, and we achieved a complete week of 100% positive satisfaction survey results, recently."
Jeff: In Chapter Six of The Service Culture Handbook, we learn how customer-focused leaders use metrics differently than most managers. Celeste, Sean, and the rest of the Customer Advocacy Team at Palo Alto Software provide a great example.
They are learning more from customers by going beyond the numbers to see what story the data is telling. This, in turn, gives them actionable insights they can use to improve service and ultimately drive more revenue.